Have you filled out your timesheet?
< Back to InsightsIf you went to design school like us, you were probably never taught about timesheets. In fact, alongside of other glorious administrative tasks like filing, written confirmations, and audit trails, timesheets were left to the purview of the “real” world.
If you are now trying to earn a living on your own time, it seems rather useful to understand how much of that time you are actually earning. But this necessity does not in any way ameliorate the painful task of logging the time one spent designing…or as you might discover, not designing.
Compounding the problem is that in a start-up, there are lots of things to worry about. Admin is generally not one of the biggest fires that needs putting out. So while there are plenty of cloud-based apps for keeping timesheets – free ones at that too – you might have even less of an inclination to sift through all those to first choose and then learn how to use a new piece of software.
For us, we turned to Microsoft Excel. It’s on everyone’s computer and within everyone’s extent knowledge of basic computer software.
Admittedly, I have a mild infatuation with Excel so using it to generate a timesheet was not only natural, but also a bit exciting. Notwithstanding my proclivities, there are some basic features within Excel that offer massive payback for the hour spent learning them. With this knowledge, you can do the following with ease:
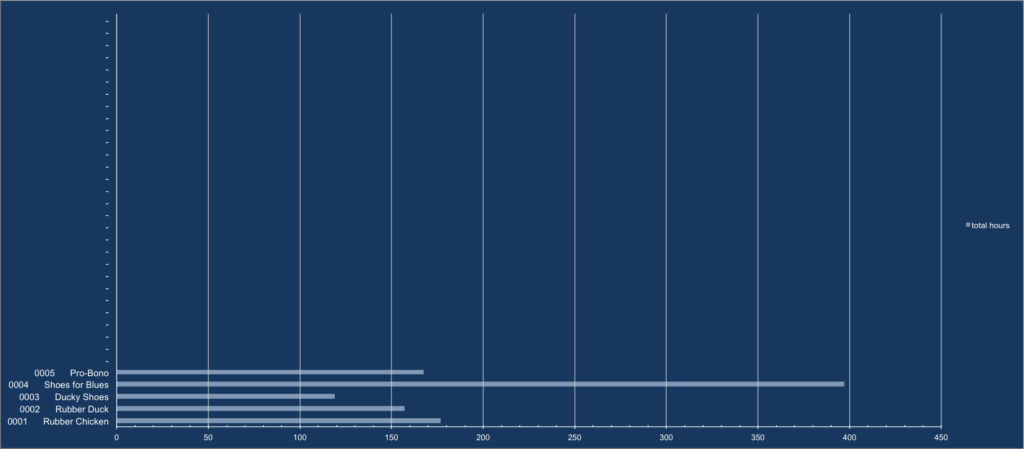
Time spent on each project.
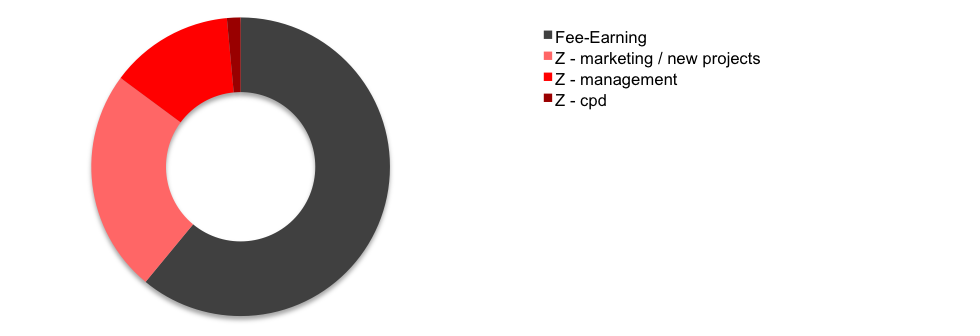
A breakdown of your time spent fee-earning, on marketing, in training, or whatever categories are useful for you.
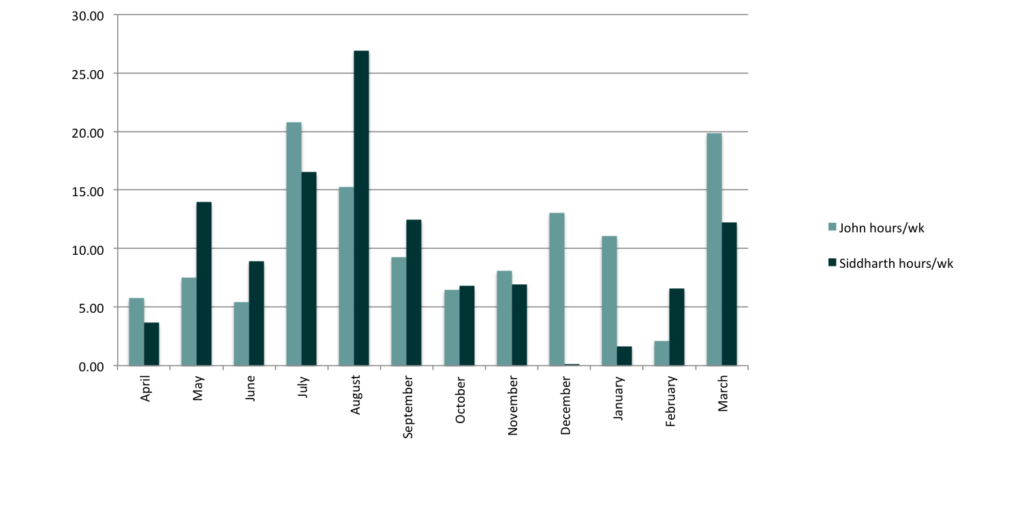
Utilisation of you and your colleagues for any given time frame.
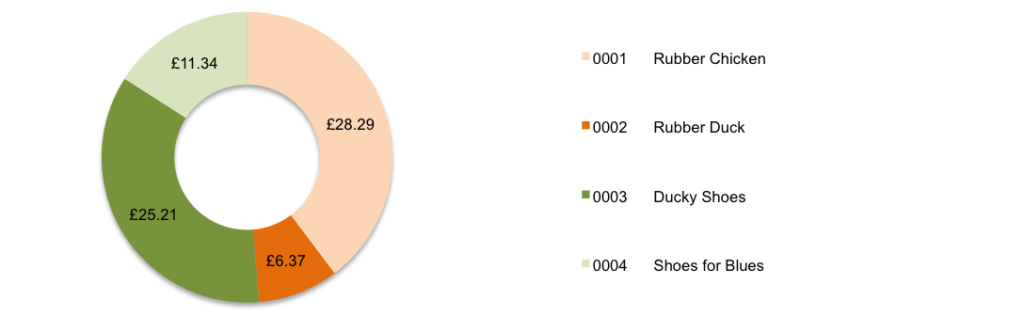
And the extremely helpful metric of your hourly rate.
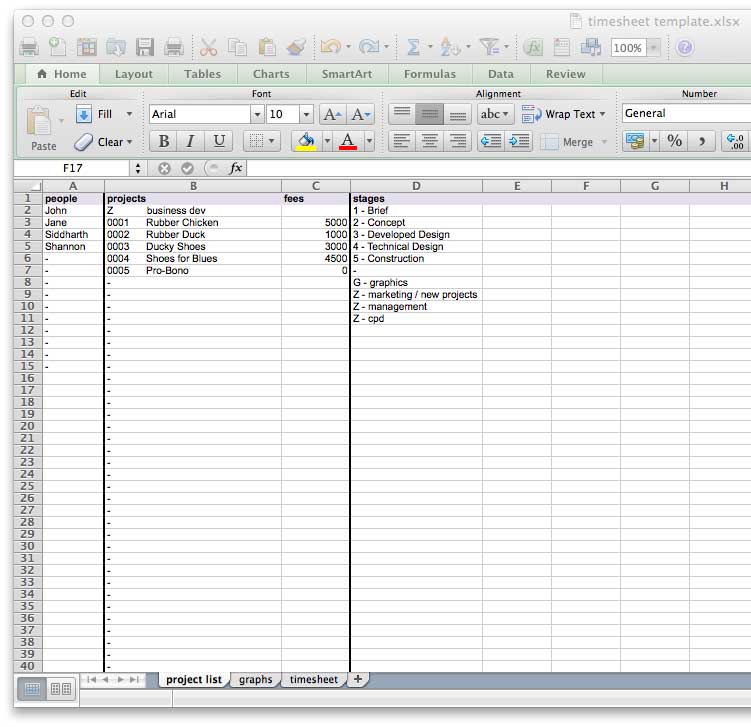
And what vast amount of Microsoft Excel knowledge does it take to do this? Well, you need to know how to set up a spreadsheet with some categories:
And you need to get familiar with Data Validation in order to have some drop-down menus:
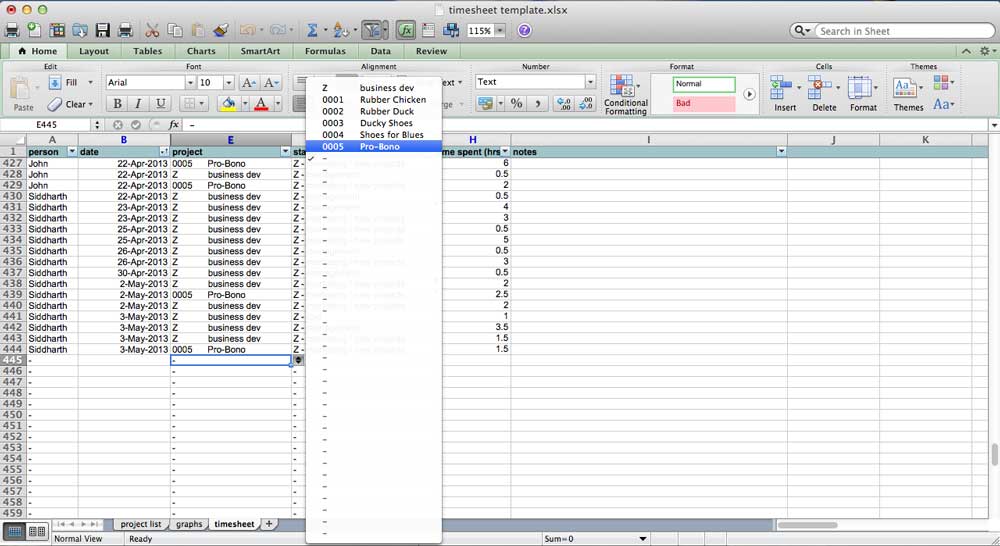
After that, the rest is just one big list that you add to, row at a time. Using Filters will help isolate this data and then you can use that limited data set to create relevant graphs.
The Excel spreadsheet that was used to make these graphs you can find here: timesheet template. I’ve made use of some slightly more advanced referencing and conditional statements, however, this was simply to allow the graphs to auto-update. Using the Filters with some manual copying and pasting of data is a more no-nonsense approach.
One closing remark about data…don’t believe everything you can count. As we have discovered, timesheets and the statistics you get from all those numbers, should be tempered against inaccurate reporting, transport, lost time, etc. While the information you glean from keeping track of your time will help towards bidding on new work and resourcing efficiency, you shouldn’t forget that people and their personalities do not easily conform to systems. So while you, yourself, may be OCD with your timesheet, undoubtedly some of your colleagues may not be. In the Physics I remember, there was always some Constant which took up the slack of the variables not working themselves out perfectly. In this case, you have to remember to allow for a constant to offset the human variable.
Let’s have a chat about your vision and
how we can help you realise it.
Collective Works are an architecture & design studio. Our network of professionals will create your perfect solution.